 ar
ar bg
bg hr
hr cs
cs da
da nl
nl fi
fi fr
fr de
de el
el hi
hi it
it ko
ko no
no pl
pl pt
pt ro
ro ru
ru es
es sv
sv tl
tl iw
iw id
id lv
lv lt
lt sr
sr sk
sk sl
sl uk
uk vi
vi et
et hu
hu th
th tr
tr fa
fa ms
ms hy
hy ka
ka ur
ur bn
bn mn
mn ta
ta kk
kk uz
uz ku
ku
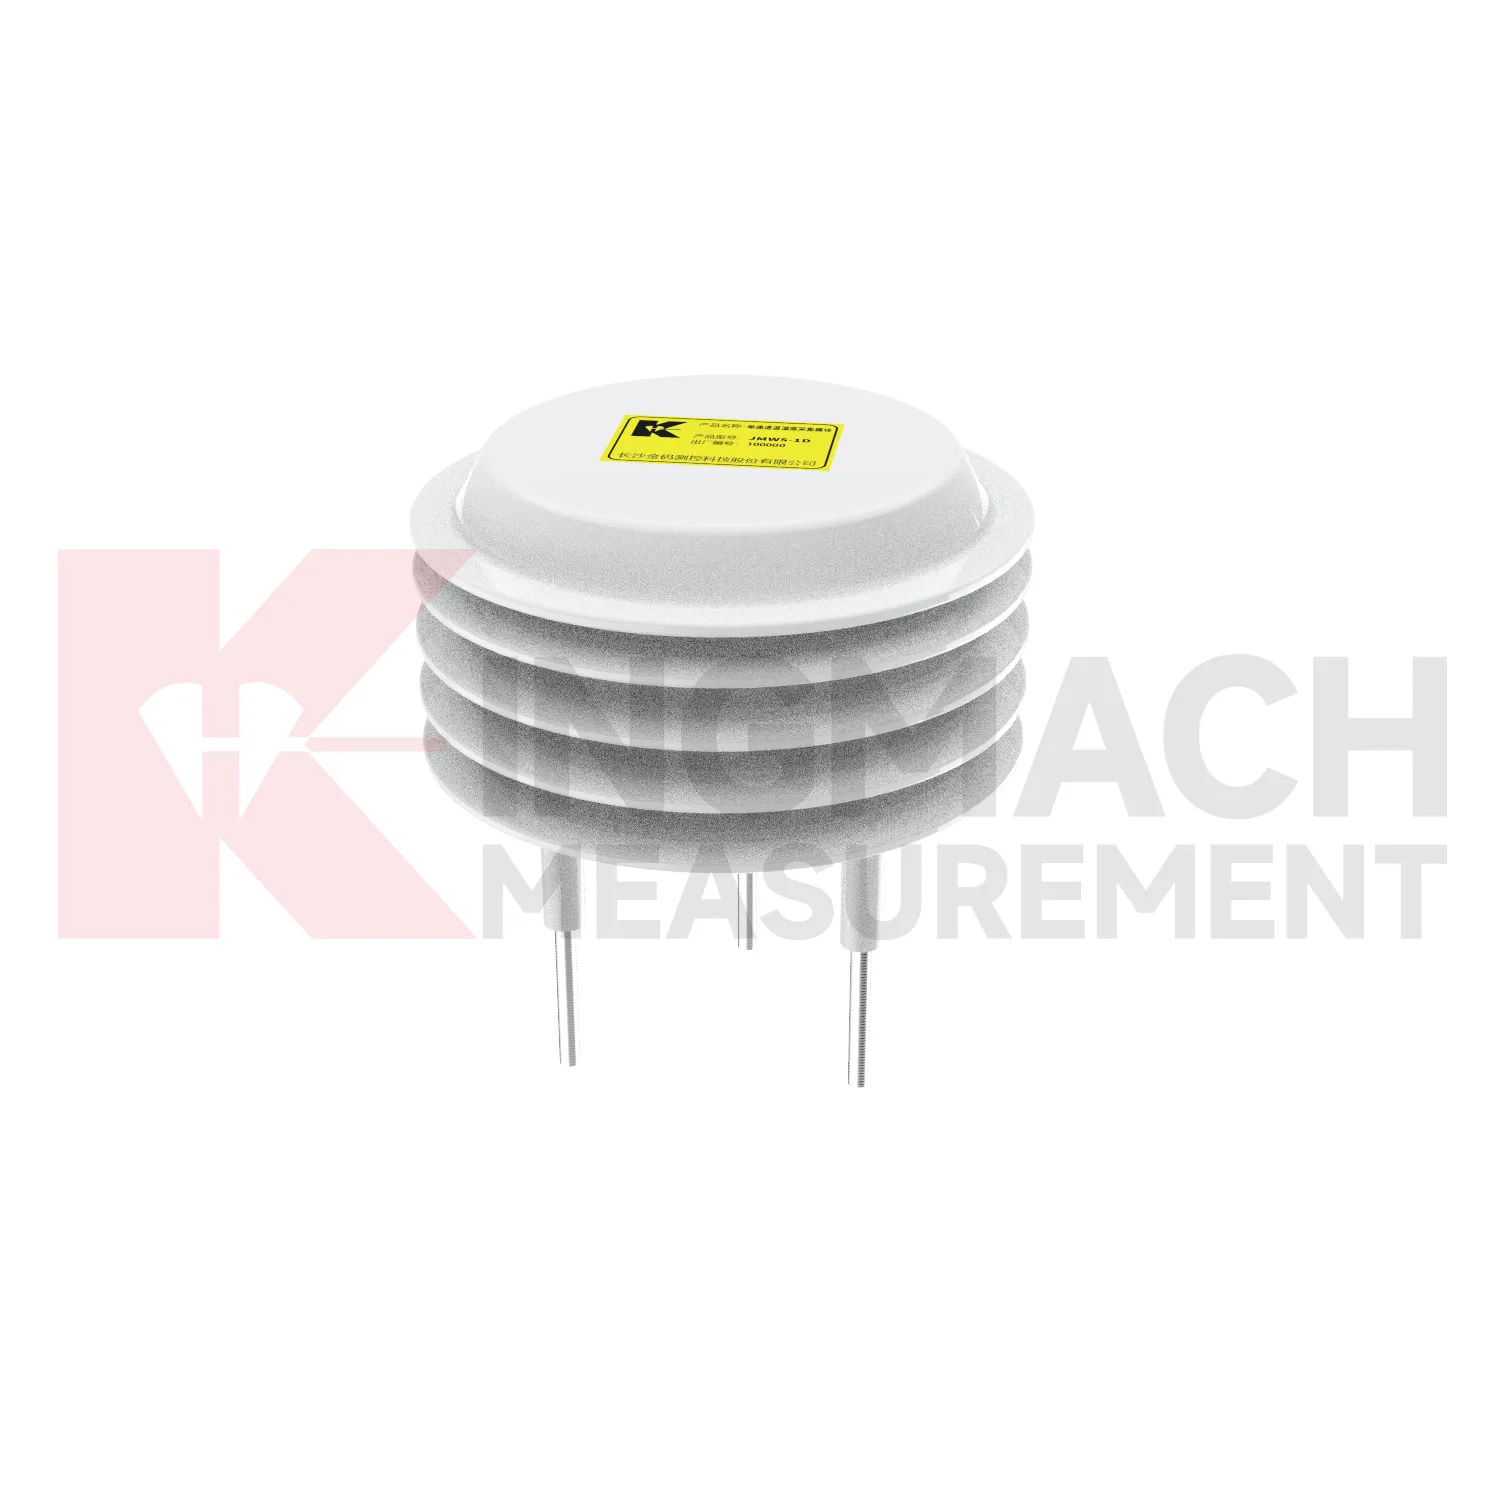
Daisy-Chained Digital Thermometer
Air temperature and humidity monitoring in Kingmach Daisy-Chained Digital Thermometer is useful wherever the environment affects people, equipment, cabinets, sensors, or structural interpretation. Underground stations, tunnels, shopping areas, factories, mines, construction zones, and equipment rooms can change quickly after ventilation adjustments, water entry, heating, cooling, or heavy site activity. A temperature and humidity point should be placed where it represents the condition being reviewed, not simply where installation is easy. If the target is a cabinet, the point belongs near the cabinet environment. If the target is an occupied or underground space, the placement should reflect airflow and working conditions. These records help explain condensation, corrosion, electrical faults, concrete curing context, and changes in other sensor readings. They are also useful for maintenance scheduling because repeated high humidity or heat exposure can shorten the life of connectors, enclosures, and acquisition equipment.
For owners, the strongest record is the one that remains understandable after staff changes. Clear units, plain point names, installation photos, maintenance notes, and linked structural channels make the data usable beyond the original project team.
For field teams, this point is most useful when the record shows the condition before the structural response, during the response, and after the site returns to routine operation. The note should include weather timing, inspection access, nearby construction, and whether the linked structural points changed in the same period.
Application of Daisy-Chained Digital Thermometer
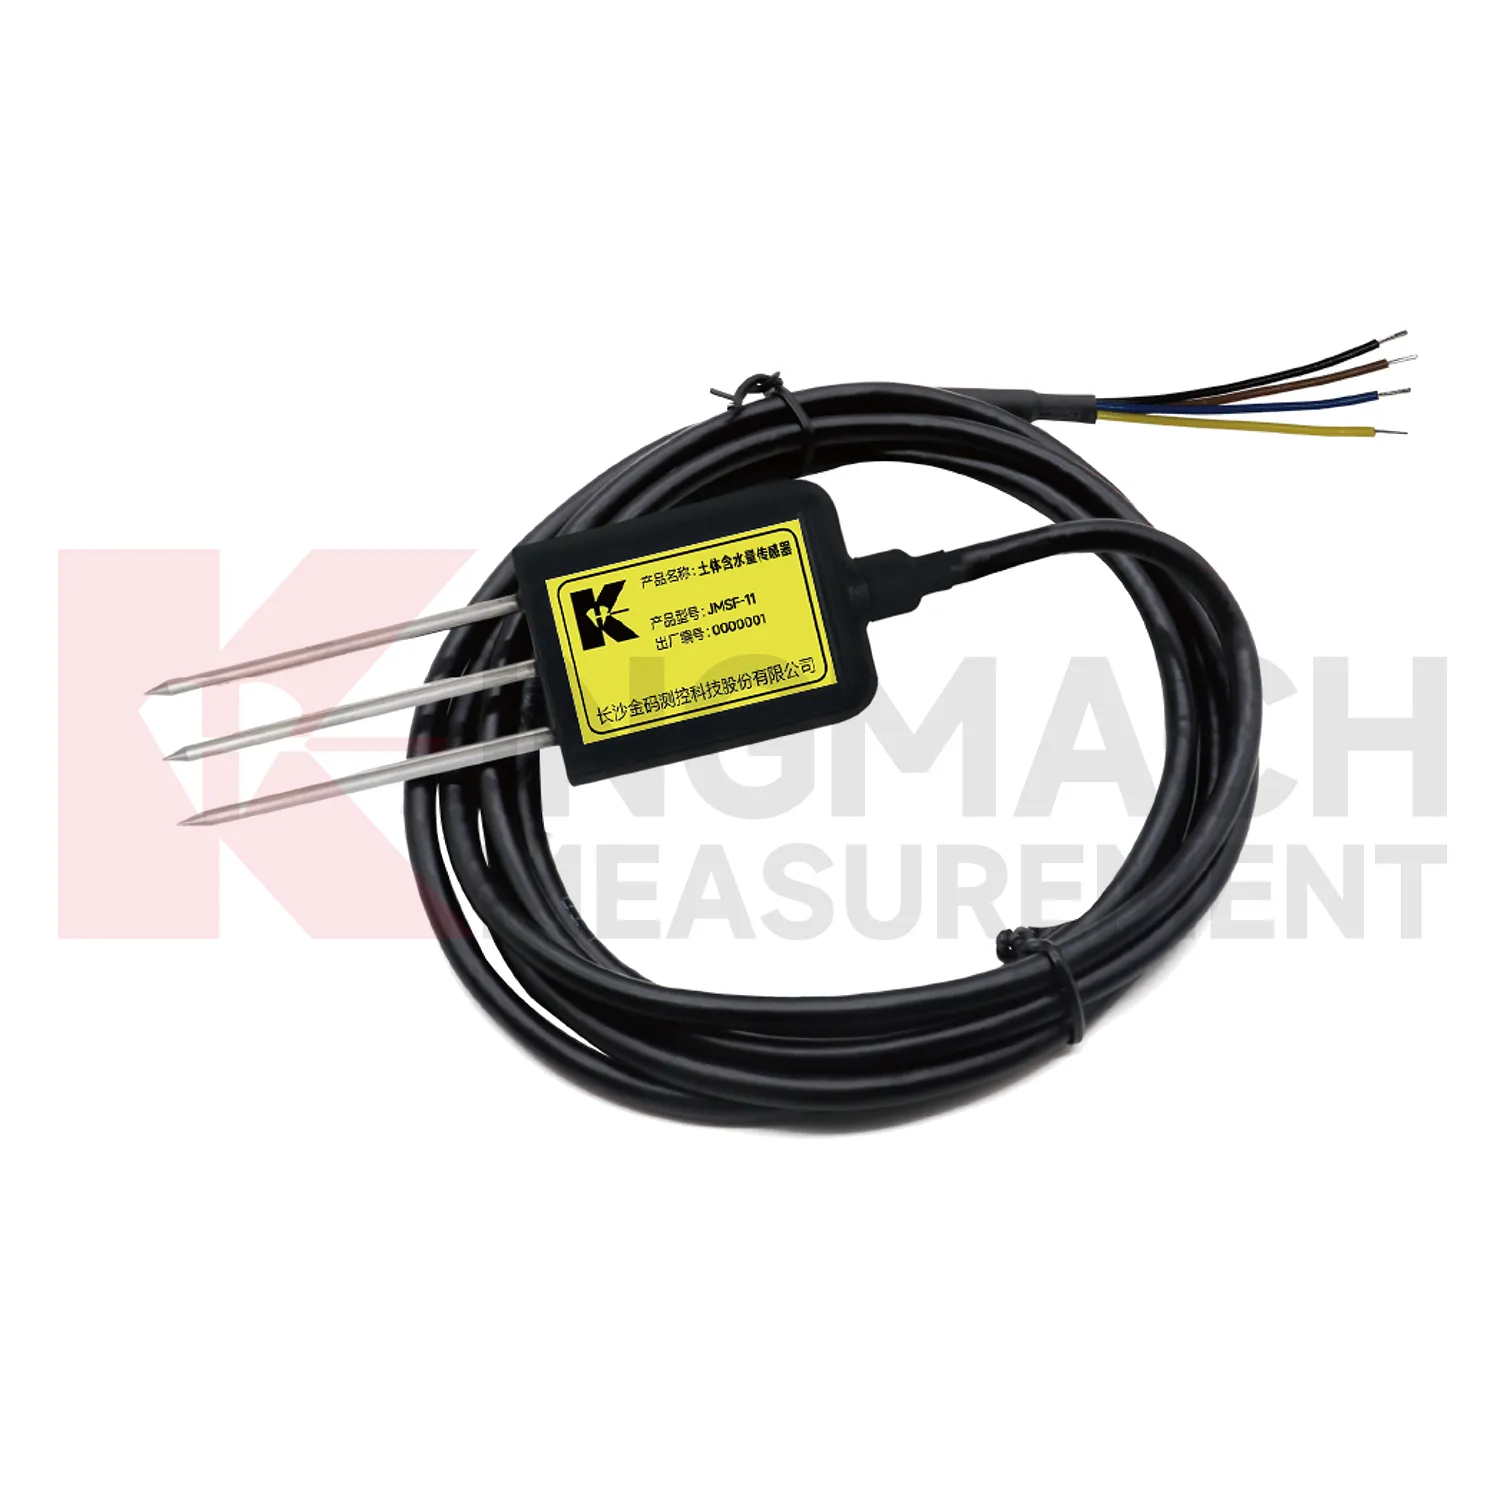
Agriculture and irrigation projects use Kingmach Daisy-Chained Digital Thermometer to understand the relation between rainfall, irrigation, soil wetness, air conditions, and plant or ground response. The purpose is not just to display weather information. The record should help managers decide when soil is drying, whether irrigation reached the intended depth, whether rainfall replaced a scheduled watering event, and how greenhouse or field conditions changed over time. Probe depth, soil type, crop zone, irrigation schedule, and cable route should be recorded at installation. Air temperature and humidity can be reviewed with soil wetness to understand drying speed and growing conditions. A consistent environmental record supports practical water management and helps avoid decisions based only on surface appearance.
Maintenance teams should record cleaning, access difficulty, enclosure condition, cable repair, vegetation growth, nearby equipment changes, and the first normal reading after work. Those notes protect the meaning of the curve when old data is reviewed months later.
The environmental point should be part of a named monitoring question. It may explain wetting, drying, wind exposure, thermal movement, cabinet stress, or pressure variation, but that purpose needs to be visible in drawings and reports.
If the reading seems unusual, the team should check the physical condition of the station before drawing conclusions about the asset. Blockage, poor exposure, loose wiring, water entry, and changed surroundings can all create misleading patterns.
The future of Daisy-Chained Digital Thermometer
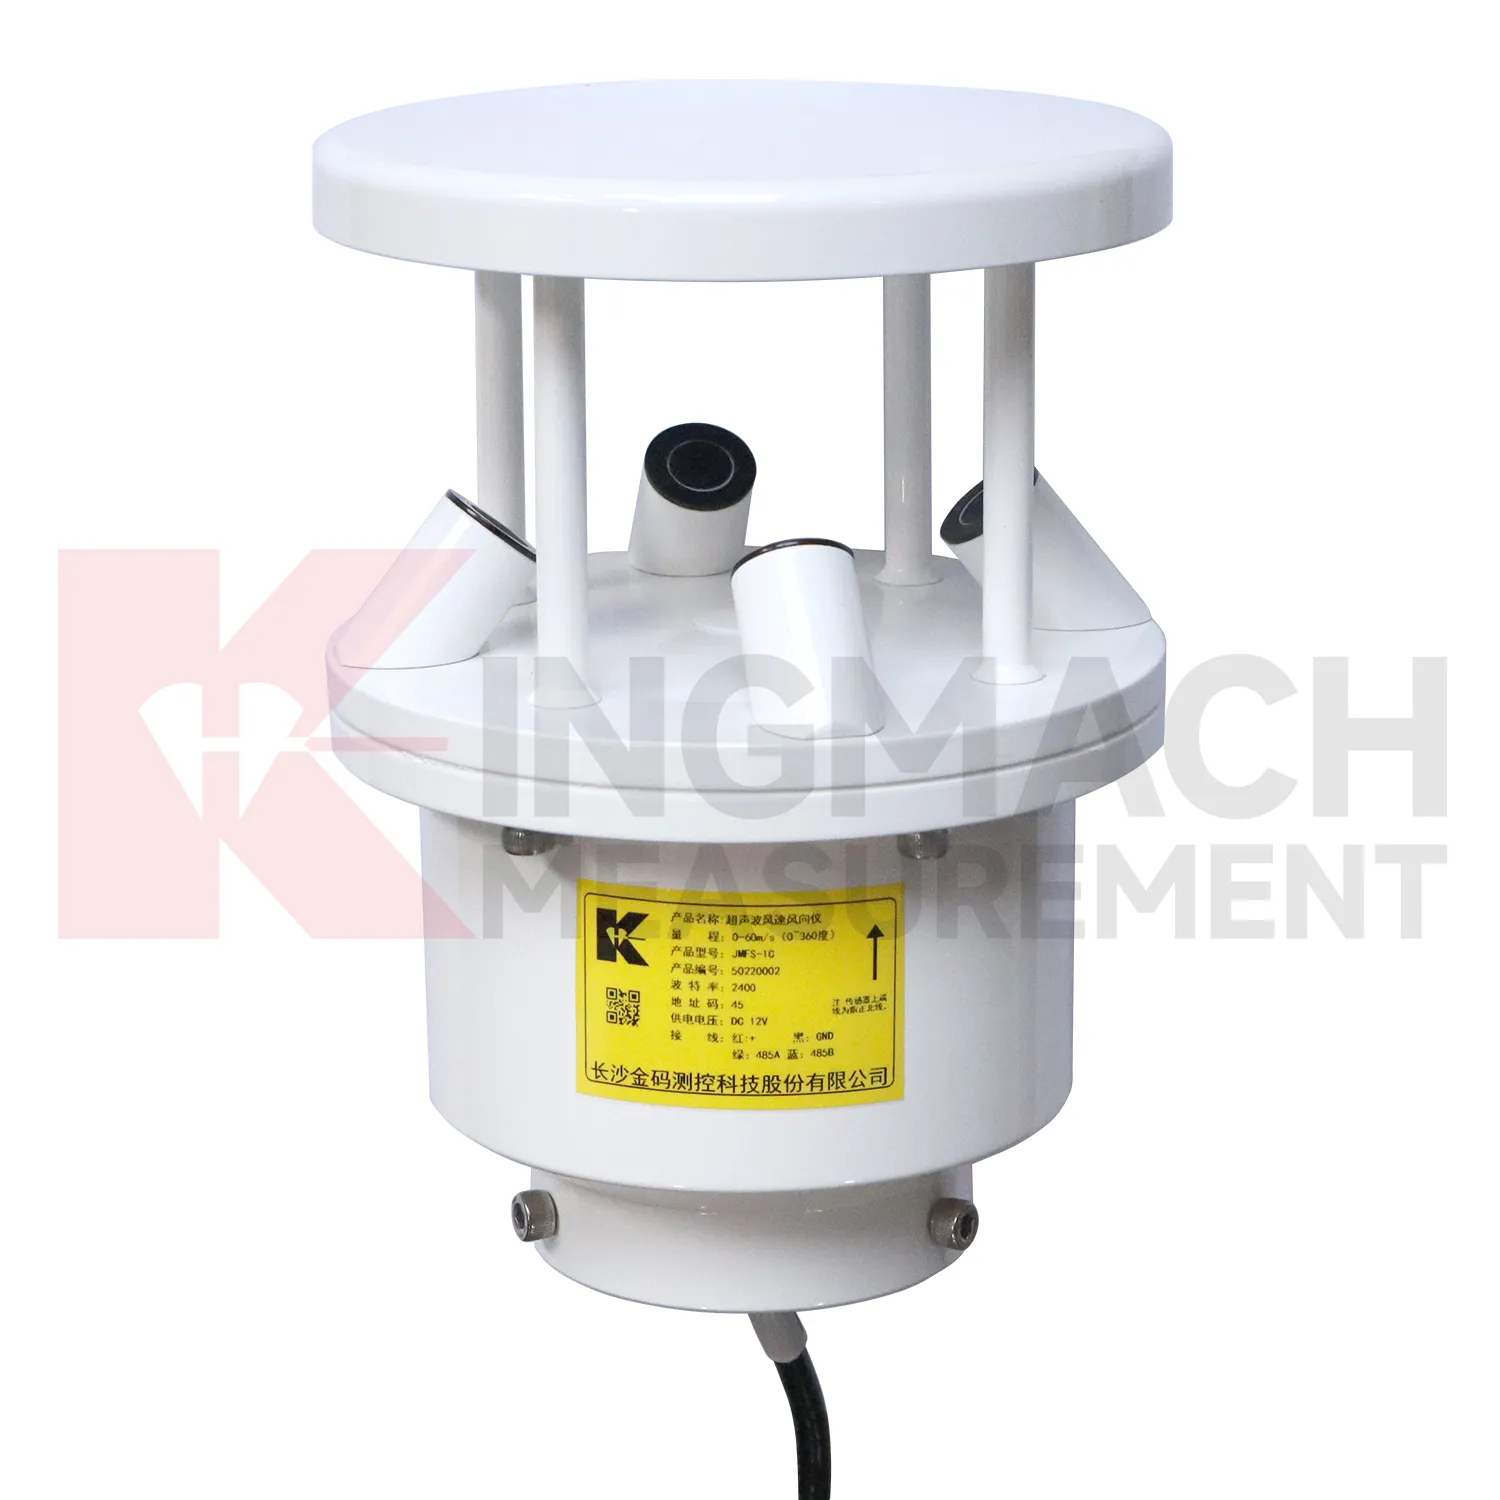
Future Kingmach Daisy-Chained Digital Thermometer reporting will make abnormal-event review more traceable. A report that says a slope moved after rain should show rainfall timing, wetting response, movement rate, and inspection results together. A report that says bridge vibration rose during wind should show wind direction, wind period, structural response, and related maintenance notes. This reduces manual work and makes reports easier to defend. Environmental records should follow the same naming and time standards as structural records. When the reporting workflow is consistent, owners can compare events across seasons, assets, and maintenance teams.
The next step is report structure that follows the event, not the instrument list. A storm report should gather rain, wetting, seepage, ground movement, photographs, and field actions. A heat-related report should gather temperature, strain behavior, expansion observations, and cabinet status. This makes the document easier for owners, designers, and field crews to review together.
Traceable reporting also protects future decisions. If the same asset produces another alarm years later, the team can compare event type, measured condition, inspection result, and repair action without rebuilding the story from scattered files. That continuity is often more useful than a single high-resolution curve.
Care & Maintenance of Daisy-Chained Digital Thermometer
Soil-condition maintenance for Kingmach Daisy-Chained Digital Thermometer should protect the contact between the buried point and the surrounding material. Air gaps, disturbed soil, cable damage, excavation, animal activity, or water paths along the cable can all affect readings. Installation records should include depth, soil type, location photo, cable route, and first stable value. During review, compare soil wetness with rainfall, irrigation, groundwater, and nearby deformation. If a buried channel becomes flat or jumps suddenly, inspect cable continuity and recent site work before treating it as a real soil change. Buried points are easy to forget, so their maintenance history must be visible in the project file.
If the reading seems unusual, the team should check the physical condition of the station before drawing conclusions about the asset. Blockage, poor exposure, loose wiring, water entry, and changed surroundings can all create misleading patterns.
A practical report links the condition value with time, place, and action. It should help a reviewer decide whether to keep observing, inspect the field point, compare nearby instruments, or record the event as normal site behavior.
Kingmach Daisy-Chained Digital Thermometer
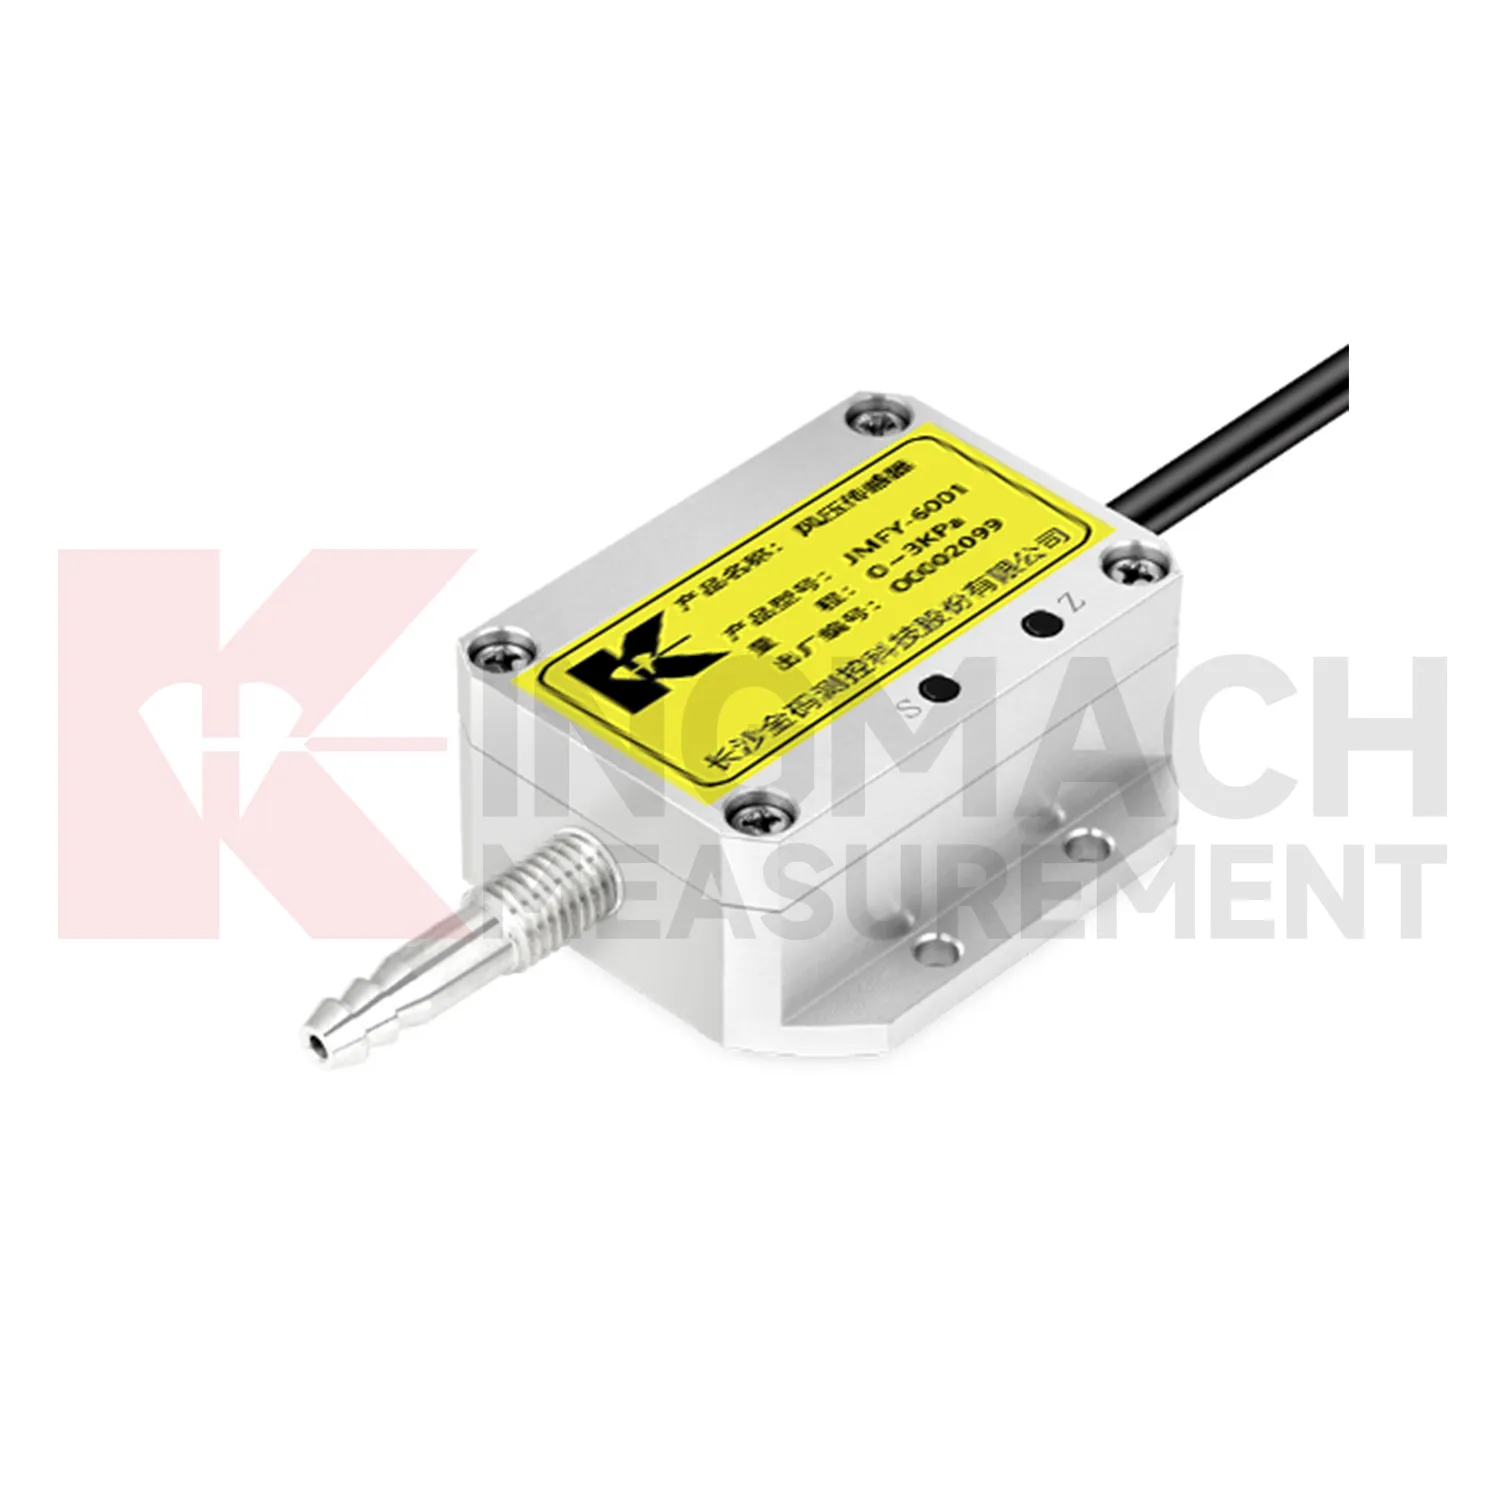
Kingmach Daisy-Chained Digital Thermometer is most useful when environmental data is treated as context for other measurements. Temperature can explain thermal expansion or sensor drift. Rainfall can explain slope movement, seepage, or delayed settlement. Humidity can affect cabinets, connectors, corrosion, and tunnel equipment rooms. Wind can explain bridge vibration, tower movement, or difficult access conditions. Soil wetness can help interpret embankment behavior and shallow ground response. These conditions do not replace structural instruments; they help those instruments make sense. A good monitoring file shows the environmental trigger, the structural response, the inspection note, and the time relation between them. That combination gives owners a clearer basis for maintenance and field decisions.
The installation file should explain why the location represents the monitored area. If the point is sheltered, shaded, exposed, buried, elevated, or placed inside an enclosure, that fact changes how later readings should be understood by maintenance staff.
During abnormal events, the first question is not only whether the value crossed a limit. The reviewer should ask what changed around the site, whether the related structure reacted, and whether a field inspection confirmed the same pattern.
FAQ
Q: Can environmental data support asset management?
A: Yes. Long-term records help owners compare weather, exposure, maintenance events, and structural response across seasons and assets.
Q: How does it help during alarms?
A: It lets reviewers check whether a structural alarm followed rain, wind, temperature change, humidity rise, or another site condition.
Q: What should dashboards show?
A: Dashboards should link environmental channels to the structural risks they explain, rather than displaying unrelated values together.
Q: Why avoid product-list writing?
A: Readers need to understand monitoring purpose and field value; long product lists make the page harder to use and less natural.
Q: What is the best review habit?
A: Review environmental data with time-aligned structural readings, inspection notes, maintenance records, and the site event that triggered concern.
If the reading seems unusual, the team should check the physical condition of the station before drawing conclusions about the asset. Blockage, poor exposure, loose wiring, water entry, and changed surroundings can all create misleading patterns.
Reviews
David Wilson
We purchased displacement transducers and settlement sensors, and the quality exceeded our expectations. Easy installation and reliable performance.
Robert Taylor
The weir flow meter is well-built and delivers accurate measurements. Great value for water management applications.
Latest Inquiries
To protect the privacy of our buyers, only public service email domains like Gmail, Yahoo, and MSN will be displayed. Additionally, only a limited portion of the inquiry content will be shown.
Charlotte***@gmail.comUnited Arab Emirates
Hi, we require instrumentation cables suitable for harsh environments. Could you advise on specifica...
Olivia***@gmail.comUnited States
Hello, we are currently sourcing high-precision strain gauges and load cells for a bridge monitoring...
Related product categories
- wind pressure sensor
- ultrasonic wind speed and direction sensor
- wind speed and direction sensor
- wind speed and wind direction sensor
- wind speed and direct sensor
- wireless wind speed and direction sensor
- wind direction and speed sensor
- wind speed and direction sensors
- tipping bucket rain gauge
- tipping bucket rain gauge resolution 0.2 mm standard
- tipping bucket rain gauges
- tipping bucket rain gauge resolution 0.1 mm 0.2 mm standard