 ar
ar bg
bg hr
hr cs
cs da
da nl
nl fi
fi fr
fr de
de el
el hi
hi it
it ko
ko no
no pl
pl pt
pt ro
ro ru
ru es
es sv
sv tl
tl iw
iw id
id lv
lv lt
lt sr
sr sk
sk sl
sl uk
uk vi
vi et
et hu
hu th
th tr
tr fa
fa ms
ms hy
hy ka
ka ur
ur bn
bn mn
mn ta
ta kk
kk uz
uz ku
ku
temperature sensor resistance
A handover-ready Kingmach temperature sensor resistance record should explain how environmental conditions were measured and why each point exists. It should include point location, measured condition, installation photo, cable route, power source, data channel, unit, first stable reading, maintenance access, and linked structural records. This matters because environmental stations often remain useful after the construction team leaves. A later owner may need to understand whether a slope moved after rainfall, whether a bridge vibrated during wind, or whether a cabinet failed after humidity rose. Without a clear handover record, those questions become guesswork. With one, the environmental record becomes part of long-term asset management, supporting maintenance budgets, inspection planning, and abnormal-event review.
For field teams, this point is most useful when the record shows the condition before the structural response, during the response, and after the site returns to routine operation. The note should include weather timing, inspection access, nearby construction, and whether the linked structural points changed in the same period.
A good review habit is to compare the condition channel with the nearest asset behavior instead of reading it as a standalone weather value. That keeps the record tied to slope movement, bridge response, tunnel equipment, dam seepage, drainage behavior, or cabinet reliability.
The installation file should explain why the location represents the monitored area. If the point is sheltered, shaded, exposed, buried, elevated, or placed inside an enclosure, that fact changes how later readings should be understood by maintenance staff.
Application of temperature sensor resistance
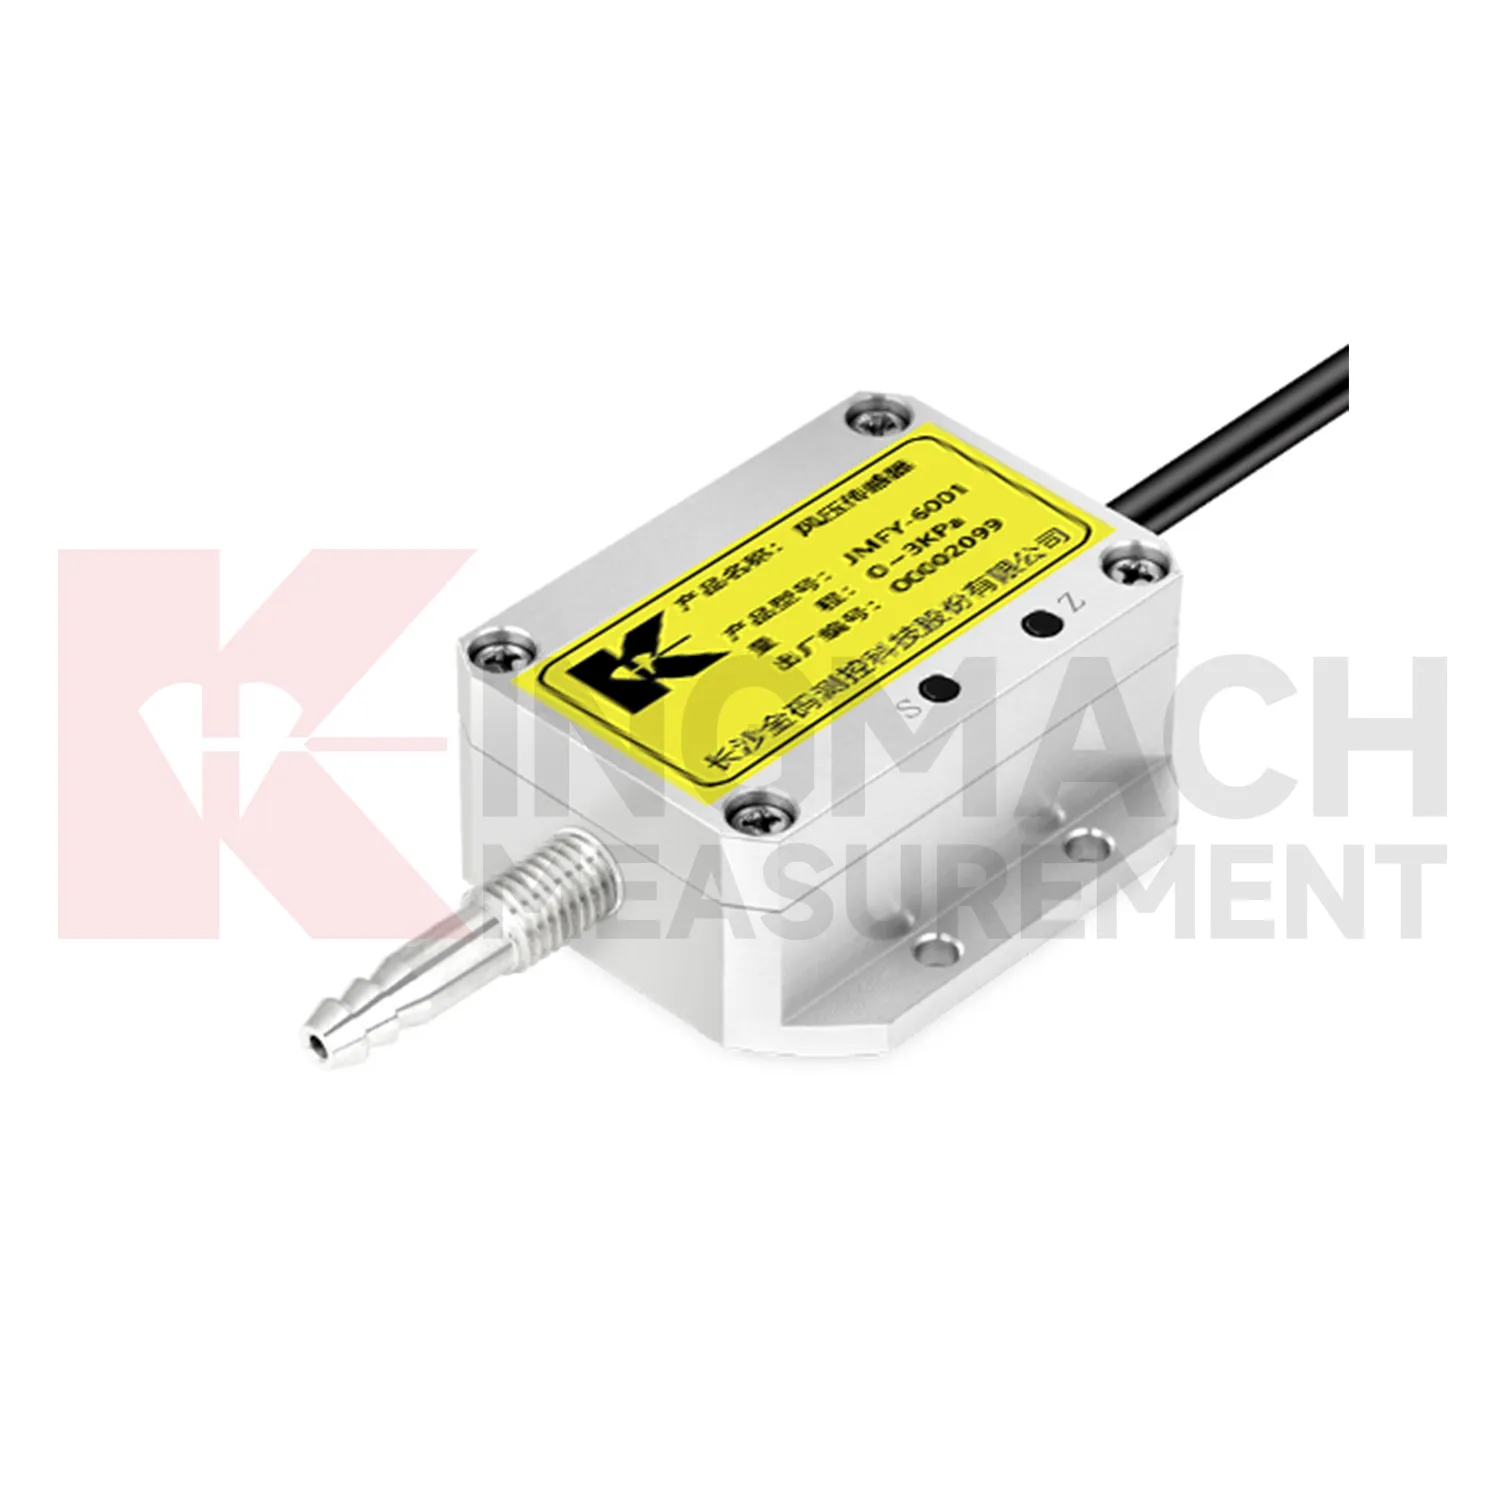
Wind towers and tall structures use Kingmach temperature sensor resistance to compare exposure with structural behavior and maintenance needs. Wind, temperature, humidity, and pressure conditions can influence vibration, tilt, access decisions, cable routing, and enclosure life. An environmental station should avoid local shielding where possible and should be mounted with stable hardware that will not create its own movement. The record is useful when reviewed with acceleration, tilt, strain, foundation settlement, and maintenance events. If a tower shows unusual motion, the team can check whether the timing matches wind direction, gust activity, equipment operation, or service work. Long-term environmental records also help plan inspections after severe weather, icing, salt exposure, or repeated high-wind periods.
A good review habit is to compare the condition channel with the nearest asset behavior instead of reading it as a standalone weather value. That keeps the record tied to slope movement, bridge response, tunnel equipment, dam seepage, drainage behavior, or cabinet reliability.
The installation file should explain why the location represents the monitored area. If the point is sheltered, shaded, exposed, buried, elevated, or placed inside an enclosure, that fact changes how later readings should be understood by maintenance staff.
During abnormal events, the first question is not only whether the value crossed a limit. The reviewer should ask what changed around the site, whether the related structure reacted, and whether a field inspection confirmed the same pattern.
The future of temperature sensor resistance
Compatibility will remain a future requirement for Kingmach temperature sensor resistance. Environmental stations often combine different signal paths, power needs, units, enclosures, cables, and data logger settings. If these details are not planned, installation becomes slow and later replacement becomes confusing. Future specifications should define data output, unit conversion, channel capacity, sampling plan, power source, protection needs, maintenance access, and platform display before installation begins. Clear compatibility keeps environmental data usable through commissioning, operation, repair, and handover. It also prevents a monitoring station from becoming dependent on undocumented field improvisation.
Future compatibility work should also cover spare parts and replacement paths. If a station must be repaired after years of service, the owner should know which signal type, unit conversion, connector style, enclosure space, and platform channel are required before field crews arrive.
This planning reduces downtime during storms, construction stages, and maintenance windows. It also helps teams replace one component without changing the meaning of the environmental record or breaking the link to structural channels.
Care & Maintenance of temperature sensor resistance
Replacement of Kingmach temperature sensor resistance components should preserve the long-term record. When changing a sensor, cable, connector, mounting pole, enclosure, power supply, data logger channel, or software setting, record the date, reason, old condition, new condition, location photo, and first stable value. Do not hide the replacement by forcing the curve to look continuous without explanation. If a point is moved to improve exposure, keep the old location and move date in the file. Environmental data often explains structural behavior years later, so future reviewers need to know when the measuring condition changed. Clear replacement notes protect the story behind the data.
A good review habit is to compare the condition channel with the nearest asset behavior instead of reading it as a standalone weather value. That keeps the record tied to slope movement, bridge response, tunnel equipment, dam seepage, drainage behavior, or cabinet reliability.
The installation file should explain why the location represents the monitored area. If the point is sheltered, shaded, exposed, buried, elevated, or placed inside an enclosure, that fact changes how later readings should be understood by maintenance staff.
Kingmach temperature sensor resistance
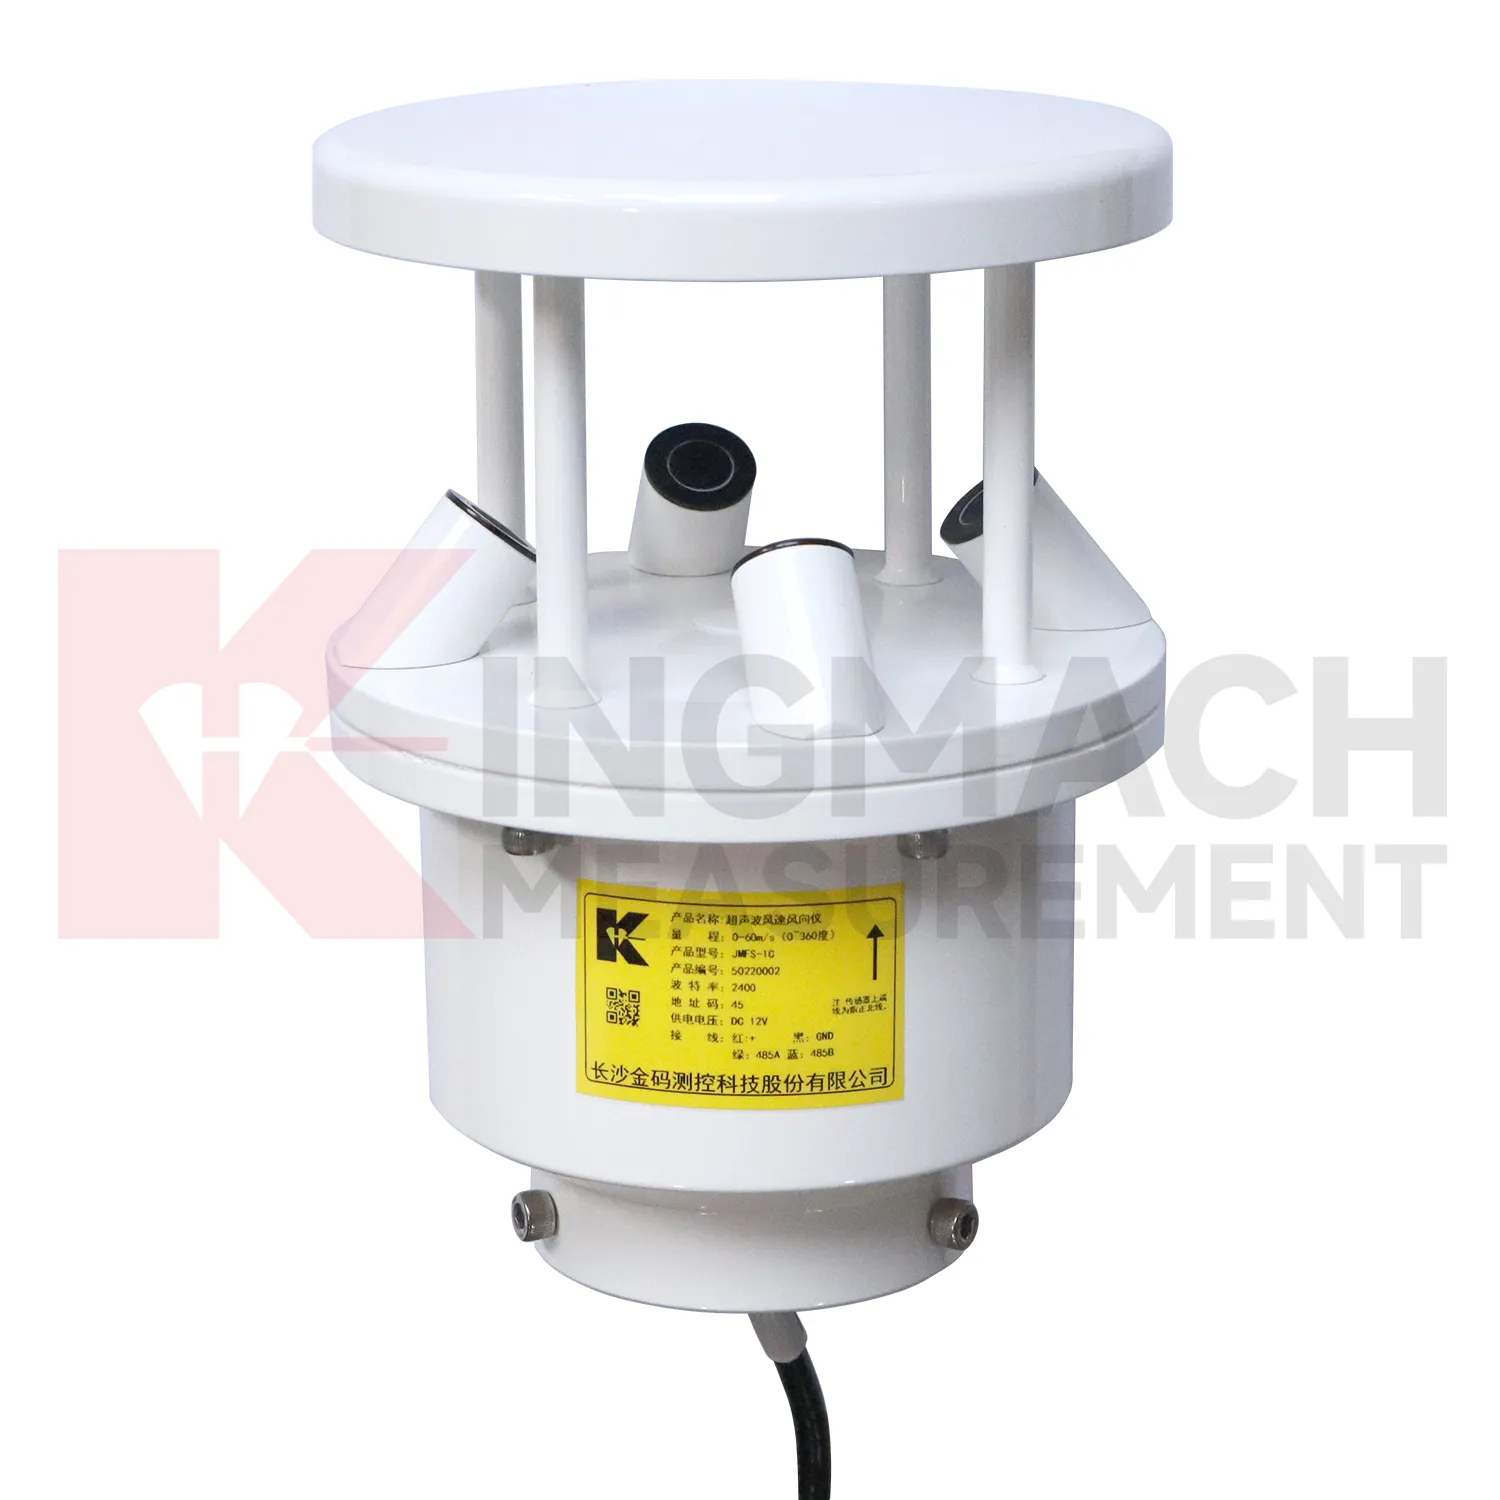
Wind exposure makes Kingmach temperature sensor resistance relevant to bridges, towers, airports, marine areas, tunnels, and high outdoor structures. Wind speed, direction, and pressure can affect vibration, access safety, temporary works, lifting operations, and inspection planning. A bridge response during strong crosswind should not be read the same way as a response during calm weather. A tower vibration record means more when the wind direction and timing are known. Wind data should be placed where it represents the monitored asset, with attention to height, obstruction, mounting stability, and cable protection. A clean wind record gives engineers a way to separate normal weather-driven response from behavior that needs a closer structural review.
For field teams, this point is most useful when the record shows the condition before the structural response, during the response, and after the site returns to routine operation. The note should include weather timing, inspection access, nearby construction, and whether the linked structural points changed in the same period.
FAQ
Q: Where should a rain point be placed?
A: It should be level, open to the sky, and away from obstructions, splash sources, roof edges, and debris-prone areas.
Q: Where should wind be measured?
A: Wind should be measured where airflow represents the asset or work area being reviewed, not behind a wall or sheltered obstruction.
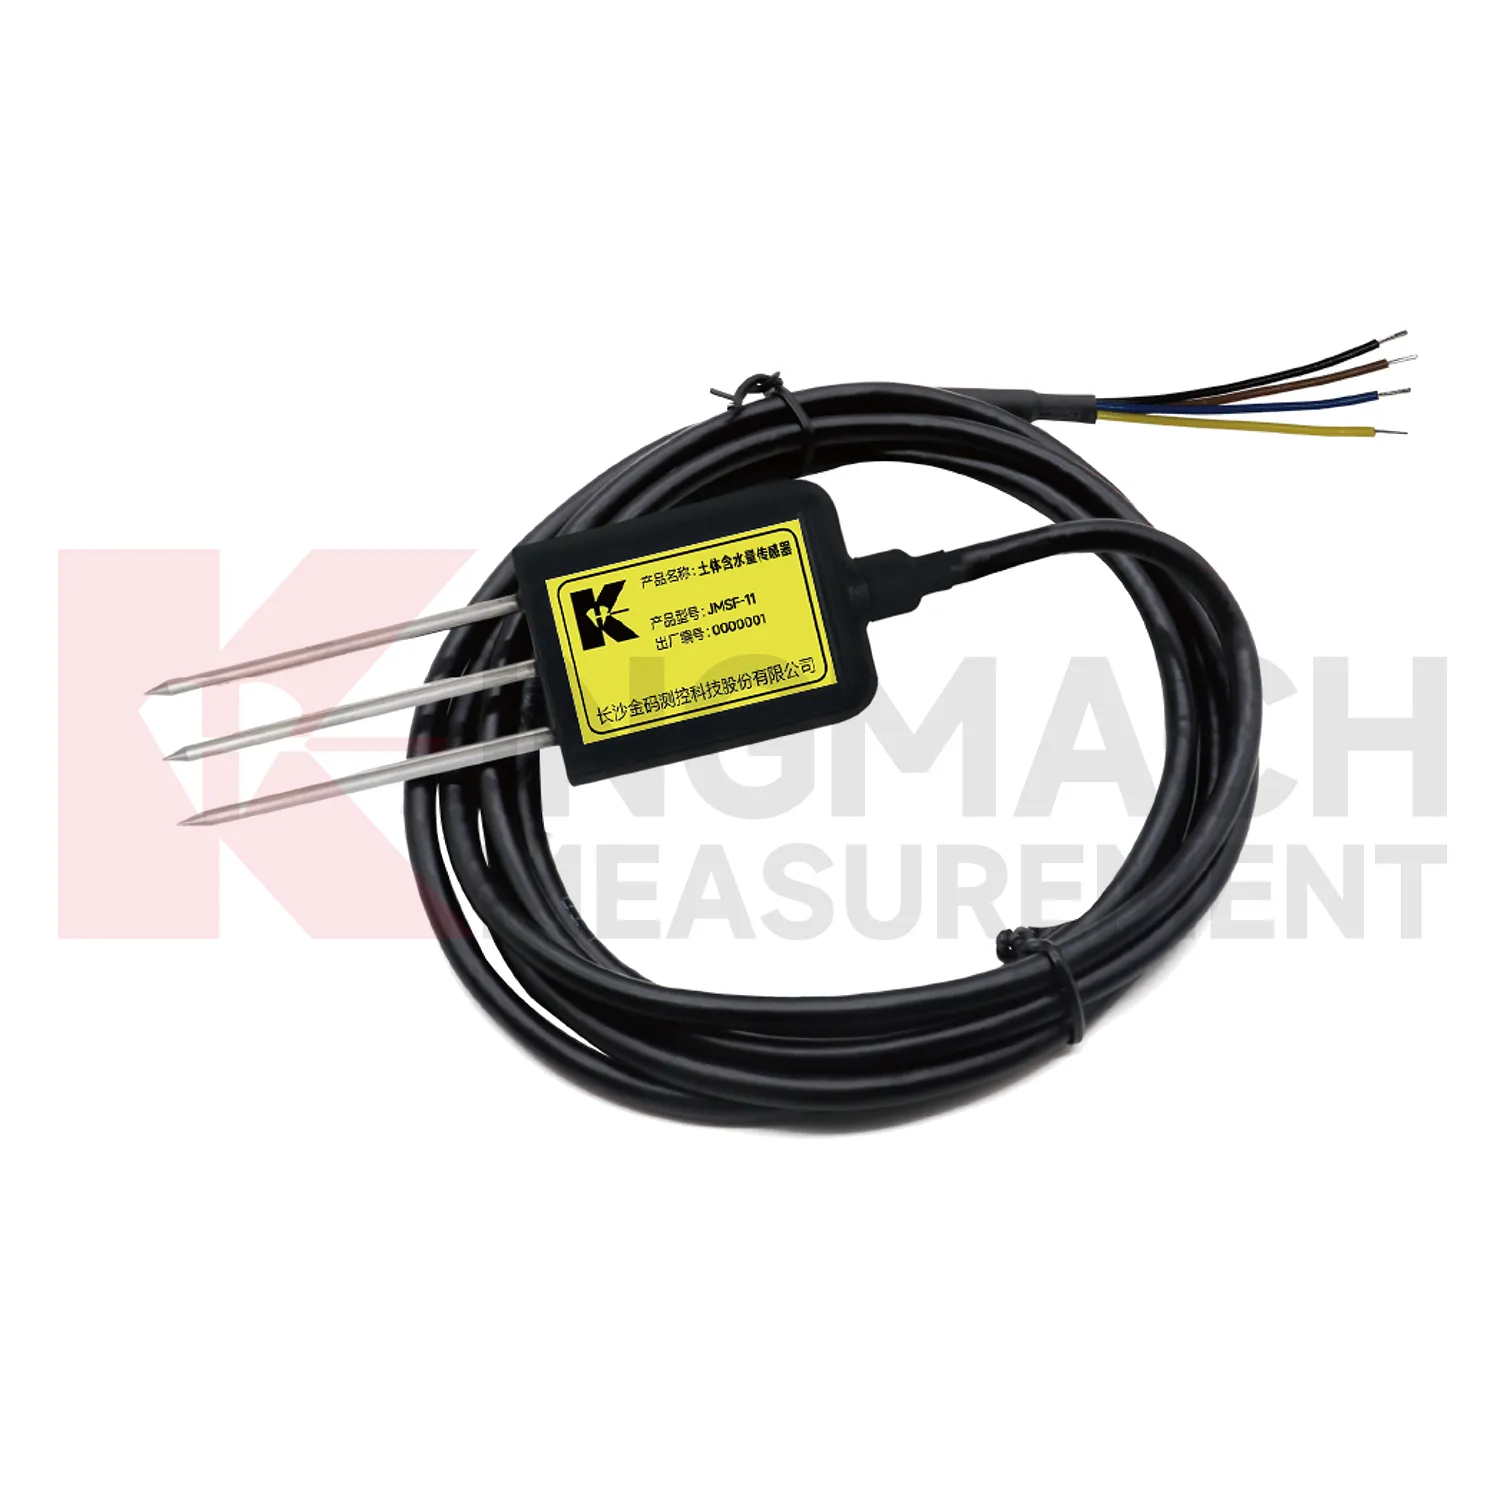
Q: How should soil points be installed?
A: They should have firm contact with the surrounding soil, a recorded depth, protected cable route, and a stable first value.
Q: What should commissioning records include?
A: Include point location, measured condition, unit, mounting photo, cable route, power source, data channel, and linked structural record.
Q: Why are photos useful?
A: Photos help future reviewers understand exposure, mounting, cable routing, and whether later site changes affected readings.
Maintenance teams should record cleaning, access difficulty, enclosure condition, cable repair, vegetation growth, nearby equipment changes, and the first normal reading after work. Those notes protect the meaning of the curve when old data is reviewed months later.
Reviews
David Wilson
We purchased displacement transducers and settlement sensors, and the quality exceeded our expectations. Easy installation and reliable performance.
Robert Taylor
The weir flow meter is well-built and delivers accurate measurements. Great value for water management applications.
Latest Inquiries
To protect the privacy of our buyers, only public service email domains like Gmail, Yahoo, and MSN will be displayed. Additionally, only a limited portion of the inquiry content will be shown.
Evelyn***@gmail.comSouth Africa
Hi, we are a contractor working on tunnel construction and need settlement sensors and displacement ...
Emma***@gmail.comCanada
Dear Sir/Madam, we are interested in displacement transducers and settlement sensors for a geotechni...
Related product categories
- tipping bucket rain gauge 0.2 mm resolution standard
- tipping bucket rain gauge data logger
- tipping bucket rain gauge resolution 0.1 mm typical
- tipping bucket rain gauge resolution 0.2 mm typical
- tipping bucket rain gauge typical resolution 0.2 mm standard
- typical tipping bucket rain gauge resolution 0.2 mm standard
- Temperature Sensor
- Chain-type Temperature Sensor
- Temperature String
- Daisy-Chained Digital Thermometer
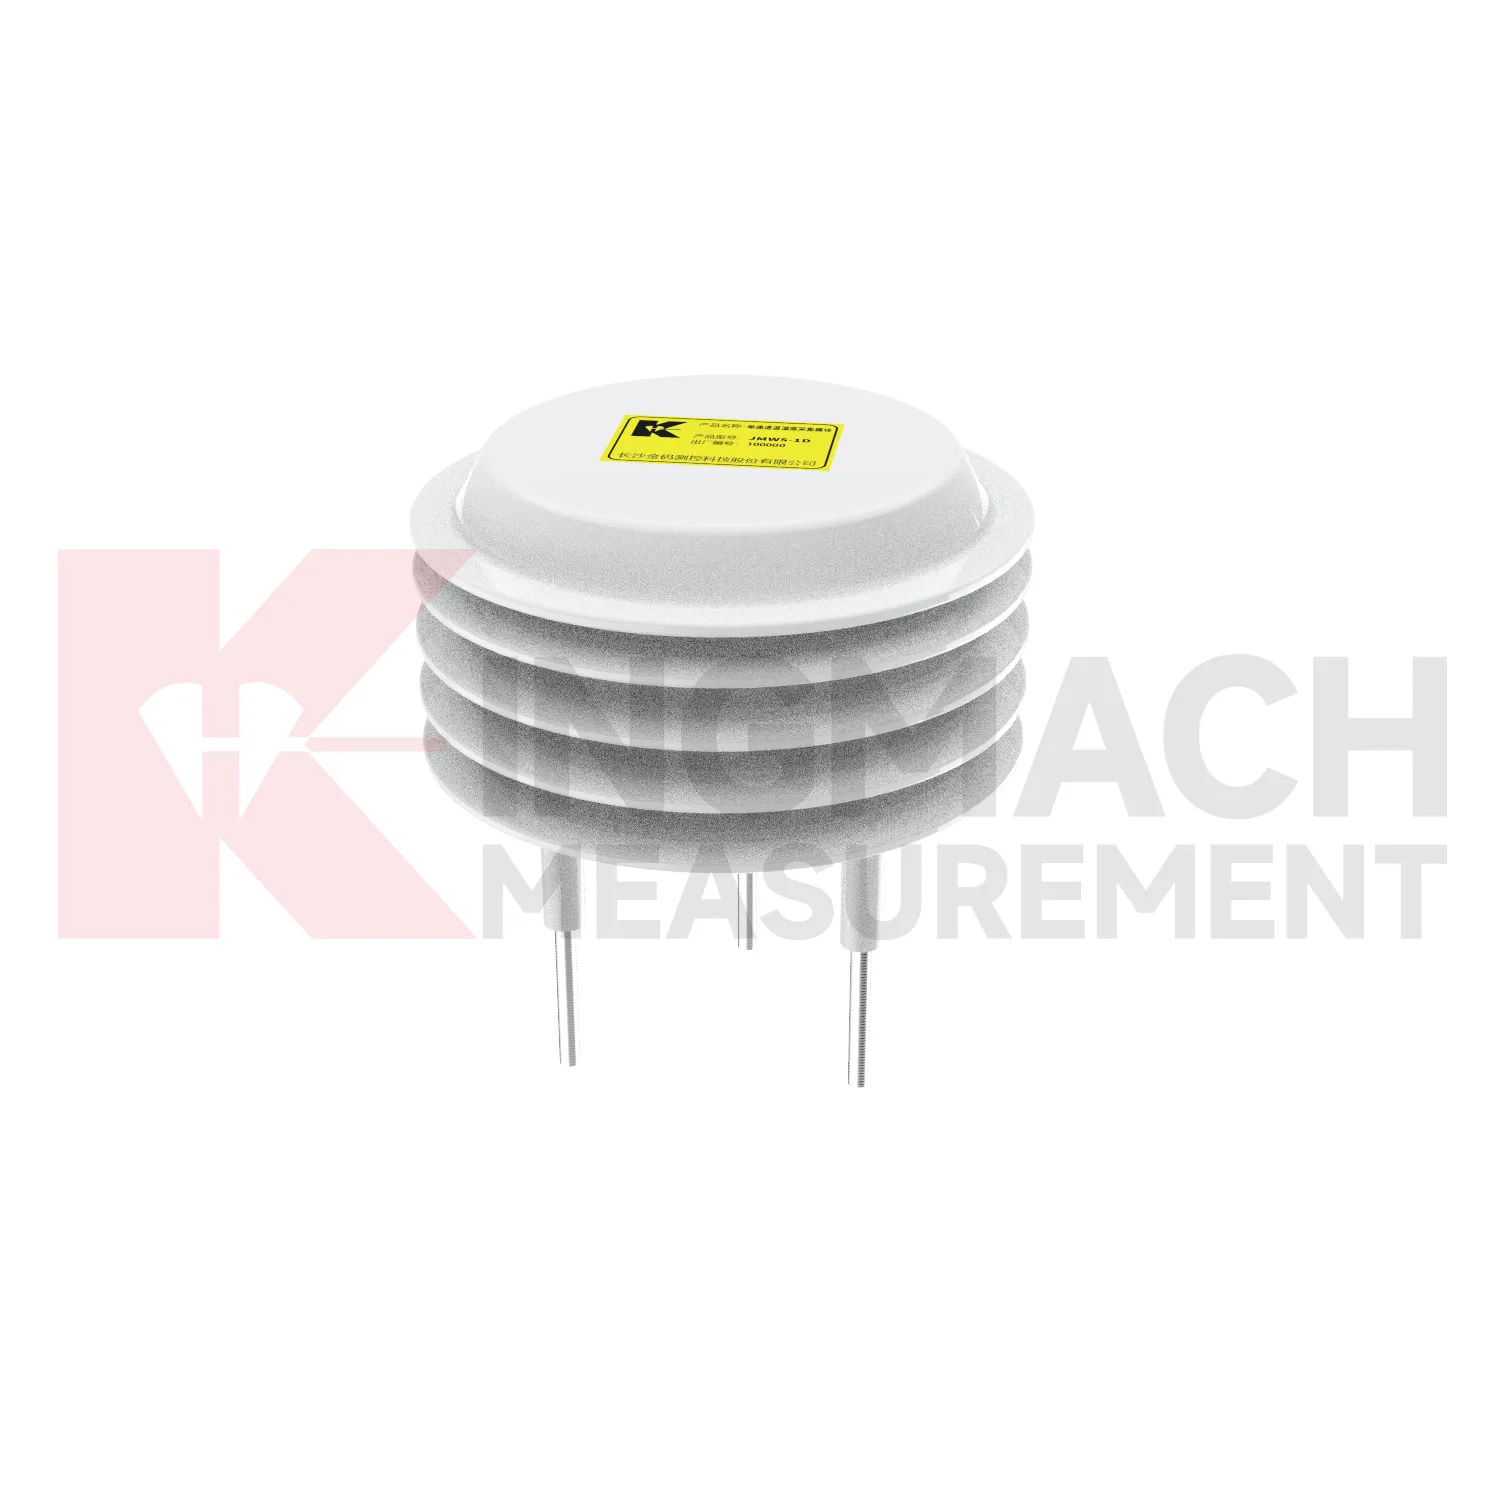
- Single-Channel Temperature and Humidity Acquisition Module
- Environmental Monitoring